First-ever data shows trade cost by country, commodity and mode of transport, offering crucial insights into global import and export expenses.
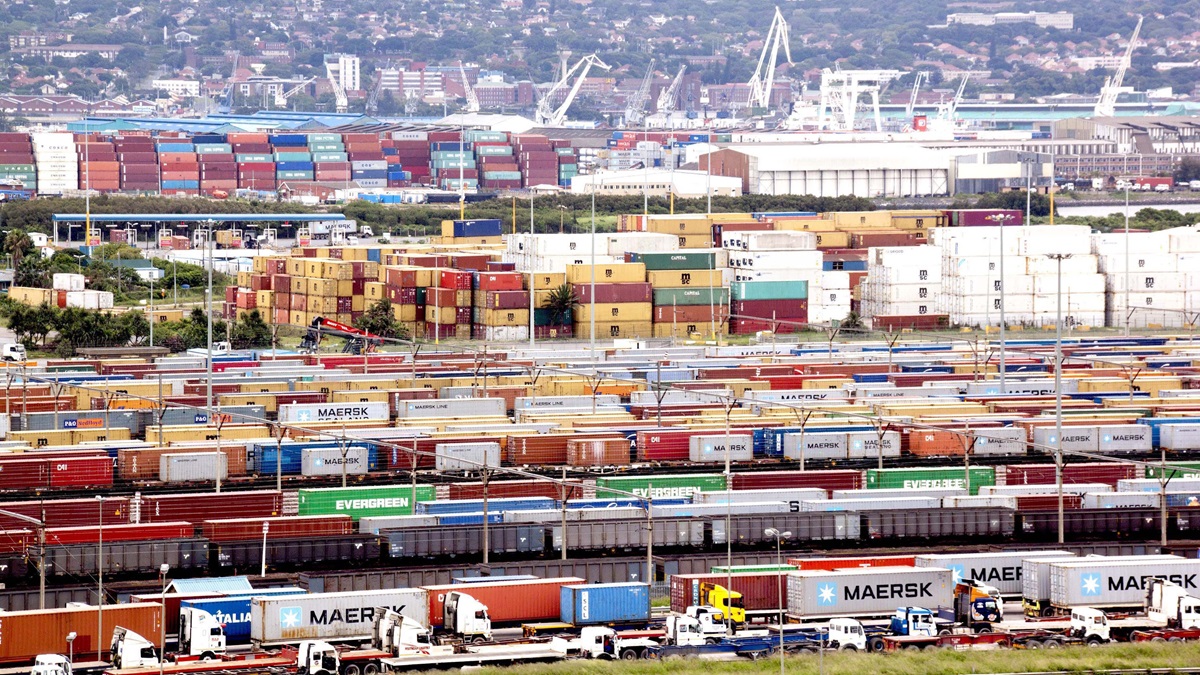
© Shutterstock/lcswart | Trucks, trains and ships in the port of Durban, South Africa.
The dataset details the value and volume of merchandise trade, including the associated costs and transport efforts for imports and exports across over 170 economies.
It reveals that developing countries exert twice the transport effort per dollar of trade compared to developed economies.
Small island developing states face the highest transport and insurance costs relative to their import expenses.
The new dataset developed by UN Trade and Development (UNCTAD) and the World Bank provides the first comprehensive global picture of the transport that enables trade, including the costs associated with moving different products between economies.
Launched at the first Global Supply Chain Forum, it draws on official national data available through UN Comtrade. The dataset covers the value and volume of merchandise trade, along with the costs and transport work required per shipment between over 170 economies from 2016 to 2021.
The data, broken down by commodity group and mode of transport, provides a suite of derived indicators such as freight rates and transport cost intensities by value and volume.
It’s the first time that trade data is paired not only by country and commodity but also by mode of transport, providing new insights into the transportation costs and efforts required by different countries for their imports and exports.
The dataset essentially reveals the costs of transporting goods between countries, such as moving iron ore from Brazil to China, electronics from China to Germany, or cars from Germany to Brazil.
Jan Hoffmann, head of UN Trade and Development’s trade logistics branch, emphasizes the significance of this data in understanding global trade dynamics. “It is crucial for policymakers and businesses as it highlights trade logistics costs and helps researchers identify areas for efficiency improvements.”
Available online via UN Trade and Development’s statistics portal UNCTADstat, the dataset allows users worldwide to browse, download tailored extractions and bulk files, and integrate the data into their algorithms through an API, at no cost.
Developing countries put in twice the transport effort
One key indicator that can be pulled from the dataset is the transport work required by different countries for their imports and exports – whether by land, air or sea.
“Basically, transport work is a measure of effort,” explains Onno Hoffmeister, a UN Trade and Development statistician. It’s calculated by multiplying the weight of the goods by the distance they need to be shipped.
Strikingly, developing economies must exert twice as much transport work as developed countries to move their imports and exports by sea per dollar of maritime trade.
This higher effort is partly due to the greater distances that goods must travel in many developing countries, particularly in landlocked economies and small island nations, which are farther from global markets. It’s also partly due to the higher average weight per dollar of the goods that developing countries trade, many of which are low-value items such as raw materials.
“What is also interesting,” Mr. Hoffmeister says, “is that this has implications for climate because the energy required to move trade comes in the form of fuel – and the use of fossil fuels ultimately results in carbon emissions.”
Small islands pay the most
Another valuable insight from the dataset is the cost per ton for countries to ship their imports and exports.
By examining the freight and insurance costs per ton of goods carried by sea, the data reveals that developing countries pay more for maritime transport than developed economies. Among these, small island developing States (SIDS) incur the highest costs.
“This data highlights the unique challenges faced by small island developing states,” Mr. Hoffmann says. “Their geographic isolation, trade imbalances and diseconomies of scale result in higher shipping costs. This is also highlighted by the statement of SIDS ministers at last week’s Global Supply Chain Forum.”
The UN Trade and Development’s statistics service will regularly update and further develop the dataset to provide ongoing insights into global trade and transport dynamics.
The World Bank’s contribution to this new dataset has been supported by PROBLUE, a multi-donor trust fund fostering a sustainable blue economy, and the Umbrella Facility for Trade, a multi-donor trust fund supporting the organization’s trade strategy.

