
Written by: Patrick Niérat and David GuerreroArticle No. 42 [UNCTAD Transport and Trade Facilitation Newsletter N°84 - Fourth Quarter 2019]
This article, written in early 2019, discusses UNCTAD maritime connectivity indexes for assessing transport conditions in developing countries. To test their relevance and applicability, it compares the situation of five African ports: Tanger Med (Morocco), Cotonou (Benin), Ngqura, Durban (South Africa) and Mombasa (Kenya). UNCTAD indicators are reviewed considering evidence from interviews with experts within port and shipping sectors.
It argues that simpler approaches, such the analysis of individual components of the index, may be more in line with assessment needs of developing countries. An alternative graphical representation is suggested. The article concludes with a provisional summary of results and prospects for further research. Since certain connectivity indicators have evolved during the writing process, we distinguish issues that have been solved from those that remain.
Review of UNCTAD indicators
The Liner Shipping Connectivity Index (LSCI)
The LSCI allows the assessment of maritime connectivity for container shipping, enabling comparisons between countries and over time. It is based on five components collected annually:
The number of shipping lines servicing a country
The size of the largest vessel used on these services (in TEU)
The number of services connecting a country to the other countries
The total number of vessels deployed in a country
The total capacity of those vessels (in TEU)
China is the best-connected country, with a score of 100 in 2004 and 159 in 2017. Table 1 shows LSCI scores for the countries examined.
Table 1: LSCI scores, selected years
| 2004 | 2005 | 2010 | 2015 | 2017 |
Morocco | 9.4 | 8.7 | 49.4 | 68.3 | 67 |
Benin | 10.1 | 10.2 | 11.5 | 17.7 | 18.4 |
South Africa | 23.1 | 25.8 | 32.5 | 41.4 | 37.4 |
Kenya | 8.6 | 9.0 | 13.1 | 11.3 | 14.9 |
In 2017, Morocco was the best-connected country, followed by South Africa, with the remaining countries achieving very similar scores. During the 2004-2017 period, Morocco’s situation changed considerably. The start of operations of Tanger Med brought the country from the level of Benin and Kenya to a 16th global position.
The LSCI was improved in August 2019, after this paper was completed. The update included an additional component: the number of country-pairs with a direct connection. An LSCI indicator at the port level was also introduced. We distinguish which issues have been solved and which ones remain.
The Liner Shipping Bilateral Connectivity Index (LSBCI)
Compared to LSCI, LSBCI assesses the quality of links, with an emphasis on routes with transshipments, namely indirect connections. UNCTAD assesses the maritime connectivity of country pairs using five indicators:
The minimum number of transshipments needed to connect two countries, varying between 0 and 3
The number of direct connections common to the two countries. This indicator counts all the potential connections between two countries with a single transshipment. It considers the common connections of each one of the two countries with the rest of the world, even if the two are not necessarily connected by a direct service. Figure 1 shows countries with direct connections to Morocco and South Africa
The geometric mean of the number of direct connections of each one of the two countries
The number of shipping companies linking both countries using direct and indirect routes
The size of the largest vessel used on the thinnest part of the itinerary between the two countries
Figure 1: Countries having direct connections to Morocco and/or South Africa
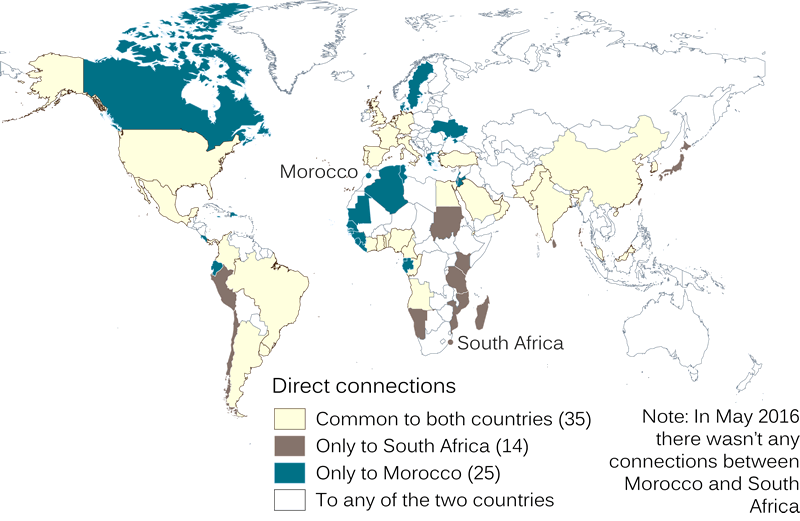
Table 2 contains figures for the selected ports and shows the same ranking of countries. The scores of Morocco exceed those of the other countries.
Table 2: LSBCI scores, selected countries
| Morocco | Benin | South Africa | Kenya |
Max | 0.73 | 0.43 | 0.57 | 0.39 |
Mean | 0.34 | 0.27 | 0.32 | 0.23 |
Median | 0.30 | 0.25 | 0.30 | 0.23 |
Table 3 provides the top 10 connections for the selected countries. For all of them, the best connections involve Europe and Asia. Within Europe, the best represented country is France which appears in all four rankings and Spain and Belgium which appear in three. Within Asia, China, Malaysia and Singapore are dominant in all rankings whereas South Korea appears in three. Links with America are not reflected within these rankings. The differences between connections within these rankings are small.
Table 3: LSBCI scores for selected countries
Morocco | Benin | South Africa | Kenya | ||||
Spain | 0.73 | China | 0.43 | China | 0.57 | Singapore | 0.39 |
Belgium | 0.71 | Malaysia | 0.43 | Malaysia | 0.56 | Malaysia | 0.39 |
France | 0.71 | Singapore | 0.43 | Singapore | 0.56 | China | 0.37 |
UK | 0.70 | Spain | 0.43 | Hong Kong | 0.55 | Sri Lanka | 0.36 |
Netherlands | 0.70 | Nigeria | 0.42 | UK | 0.55 | Spain | 0.35 |
Germany | 0.70 | Hong Kong | 0.41 | Belgium | 0.54 | France | 0.35 |
China | 0.64 | France | 0.41 | Netherlands | 0.54 | UAE | 0.35 |
Malaysia | 0.63 | S. Korea | 0.40 | France | 0.54 | Italy | 0.35 |
S. Korea | 0.63 | Ivory Coast | 0.40 | Germany | 0.54 | Belgium | 0.34 |
Singapore | 0.62 | Ghana | 0.40 | S. Korea | 0.53 | South Africa | 0.34 |
Critique
These indexes reasonably enable rankings. However, several reasons justify seeking alternative representations.
The LSCI considers the connections of a country globally. A country very well connected to some countries and very badly connected to others will get an average score. This is the case of many African countries, keeping historical connections with Europe and developing new ones with Asia, but poorly connected to the rest of the world. The resulting global index will be rather weak, even if the countries can be well connected to their most relevant economic partners. The lack of direct connectivity is a barrier for trade with other countries, but also these flows are weak or inexistent.
Therefore, a weak LSCI score does not necessarily imply that a country is isolated: a poorly connected country could be well connected to its partners. Conversely, a very high LSCI does not necessarily mean that the country effectively trades with many other countries. The high score of Morocco is related to Tanger Med, and results from the transshipment activity (95% of its throughput) rather than from trade relations.
Although more operational from the perspective of developing countries (reflecting the detail of connections to other countries), the LSBCI does not assess connectivity with economic partners. Economic partners change from one country to another. For example, Mombasa is more oriented towards Asia than Europe, while Tanger Med is more oriented towards Europe. The top-10 best connections of selected countries highlighted these differences. To be complete and effective, the connections to each of these countries should be examined raising questions about the significance of small differences in LSBCI scores.
What is the significance of minor variations in the LSCI or LSBCI rankings on the hierarchy of countries network centrality? Both LSCI and LSBCI are a result of the sum of several factors aiming to reflect the potential for competition of the centrality of networks. While large variations or shifts in trends certainly reflect real changes, small variations from one year to another, or within the country rankings of LSCI or LSBCI should be interpreted with great caution.
Both indexes are calculated for 155 countries. Not all countries are equally important for the selected case studies. There is no information on the relevance of factors explaining the top-10 best connections list. For example, the best LSBCI score on our dataset, Morocco-Spain, results from significant inter-hub connections between Tanger Med and Algeciras, and not from the importance of trade (in the sense of containerized transport) between the two countries.
The indicators are often calculated at a country level. They do not distinguish Tanger Med from Casablanca, or Durban from Ngqura. When the largest port of a country is analysed, it can be considered that the score of the country is like the score of that port. Not all these countries are equally important for the selected case studies. The LSCI calculated at the port level (introduced in 2019) allows distinguishing between different ports within a country.
The former remark is also valid for the overseas countries to which a port is connected. It is possible to be well connected to a country without being well connected to the area of the country where the main trade partners are located. This could be the case of large countries like China, or countries where inland connections are poorly developed.
Both indexes rely on several indicators whose details disappear. Therefore, variations in connectivity scores do not provide information with respect to the contribution of each component. For example, LSBCI distinguishes direct and indirect links. This distinction, which is particularly relevant, is lost in the index.
The interpretation of the indexes is sometimes debatable. For example, the lack of direct connections between two countries is supposed to imply (1) extra transport costs and a reduction of the value of exports (42-55%), or (2) an increase of the distance between two countries of 2612 km. From the perspective of developing countries, the lack of connectivity resulting from lack of trade is more relevant.
Proposal
A geographical approach is proposed to assess the level of connectivity of selected ports. It focuses on four questions:
With which countries is the port directly connected to? For the sake of simplicity, the countries have been aggregated into regions, but it is possible to look at the connections by country or by port. At this stage, the number of weekly services has been chosen.
How can the countries be reached without direct connections? Transshipments are necessary through hubs directly served and giving access to many ports.
What is the level of competition within a port?
What is the capacity of a port?
In this context, we suggest the following indicators to measure maritime connectivity:
Number of weekly connections to Europe
Number of weekly connections to Africa
Number of weekly connections to Asia
Number of hub regions directly served
Largest vessel calling at the port
Number of ships calling at the port in a week
Number of alliances
The aim is focusing in direct services (indicator 4), using the schedules provided by shipping companies. This allows differentiating the connections with a few selected regions (Asia, Africa and Europe), with some services common to several regions. This distinction is useful to appreciate the geographical specialization of ports. Direct services are also monitored by UNCTAD at country level, without considering their frequency.
For the assessment of indirect connections four hub regions have been identified. The list of the top 100 transshipment hubs published by Drewry (2017)[i] was used to identify those potentially relevant for the African region. Four “hub regions” have been defined: Mediterranean, Middle East, Asia and Southern Africa. This approach seemed more reasonable and less onerous to implement than computing all possible port links, as is the case for LSBCI.
These choices are imperfect. For instance, although possible, the analysis of maritime connections for real trade partners has not been undertaken. Connections to hubs remain vague since the possibilities of real connections have not been examined. Moreover, the suggested regions are too vast. These aspects can be expanded by adapting the geographical patchwork to be more precise.
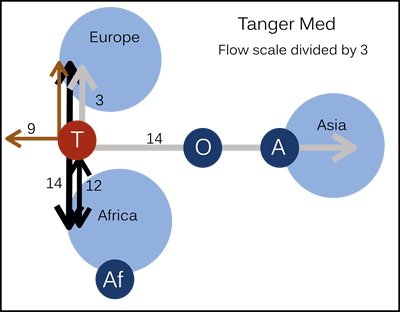
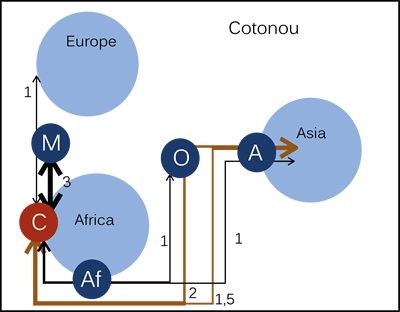
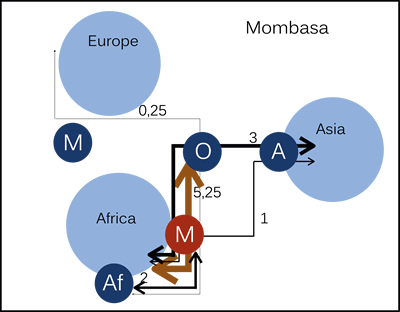
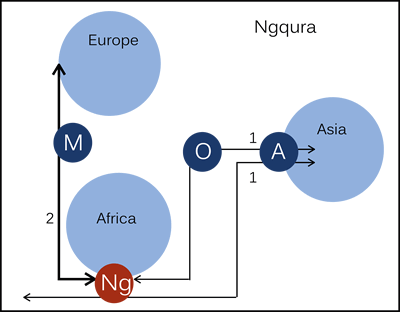
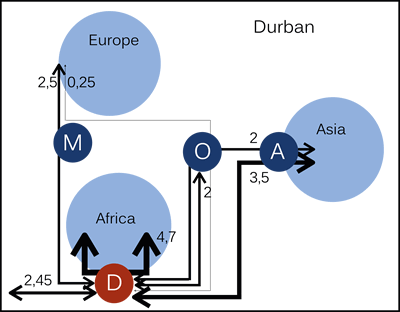
Figure 2 summarizes the variety of situations of the selected ports regarding maritime connectivity. For each case, there is a graphical illustration of the regions served, the hub regions, and the weekly services. Excepting Tanger Med, ports are better connected to Asia than to Europe.
Figure 2. Maritime connections, for selected ports
Conclusion
This paper has reviewed existing indicators and suggested a new framework for assessing maritime connectivity from the perspective of developing countries. It has emphasized the geographical dimensions, suggesting new representations for a selection of case studies. It provides a view of maritime connections more adapted to expectations of decision-makers aiming to link the commercial success of ports with regional development issues. Although changes brought by UNCTAD in 2019 provide a more precise view of maritime connectivity, important issues remain.
Patrick Niérat ¦ Université Paris Est, Ifsttar, Ame-Splott (France)
David Guerrero ¦ Université Paris Est, Ifsttar, Ame-Splott (France)
[i] Drewry Maritime Research, 2017. Container Market Annual Review and Forecast 2017/18., Quarter 3, October.