Written by Jan Hoffmann, Hassiba Benamara, Daniel Hopp, and Luisa Rodriguez, UNCTAD, Article No. 60 [UNCTAD Transport and Trade Facilitation Newsletter N°87 - Third Quarter 2020]
Official statistics on gross domestic product (GDP) and trade growth are produced with delay, gaps and time lags. When navigating through crises such as the COVID-19 pandemic, access to near real-time data becomes critical for making sound decisions. As a result, economists and policy makers are increasingly relying on alternative high-frequency data that can be used as proxies to estimate wide-raging economic variables. Supported by technological advances, such as automatic identification system (AIS) data, as well as improved data collection techniques and reporting by industry, maritime transport data are becoming an important source of high frequency statistics and market intelligence. These span statistics on port calls, ship sailing speeds, port traffic volumes, shipping schedules, capacity deployed and the time ships spend in port.
Tracking the pandemic with ship port calls
Container shipping is closely correlated with developments in the world economy, manufacturing, and consumption. Consequently, containership port call patterns could generate useful insights into the underlying macroeconomic trends.
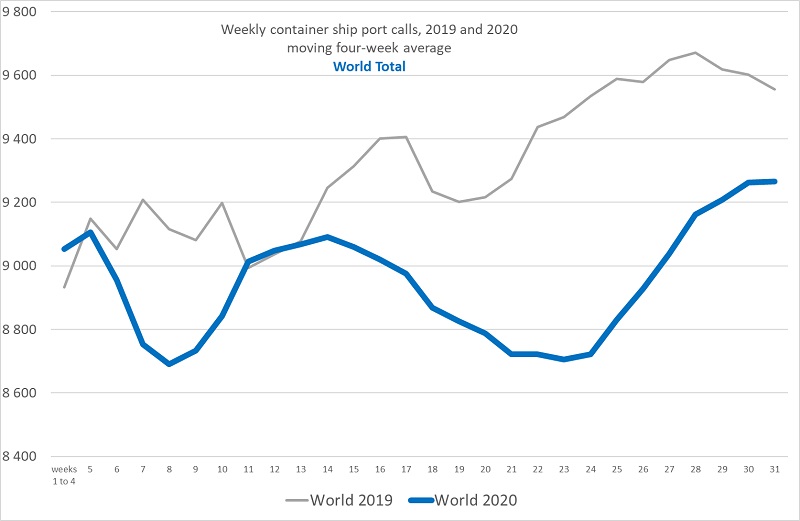
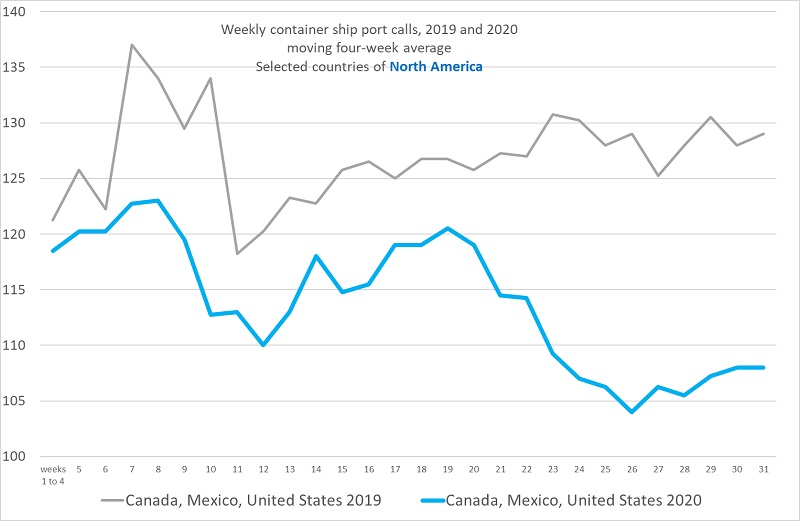
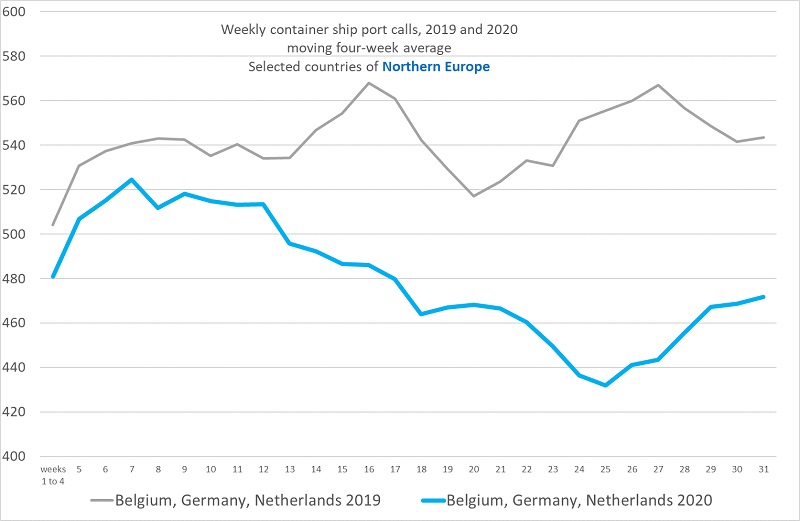
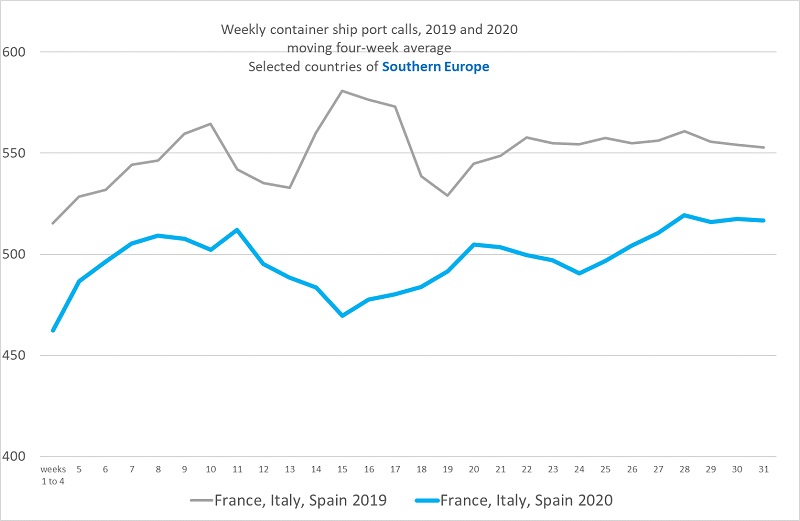
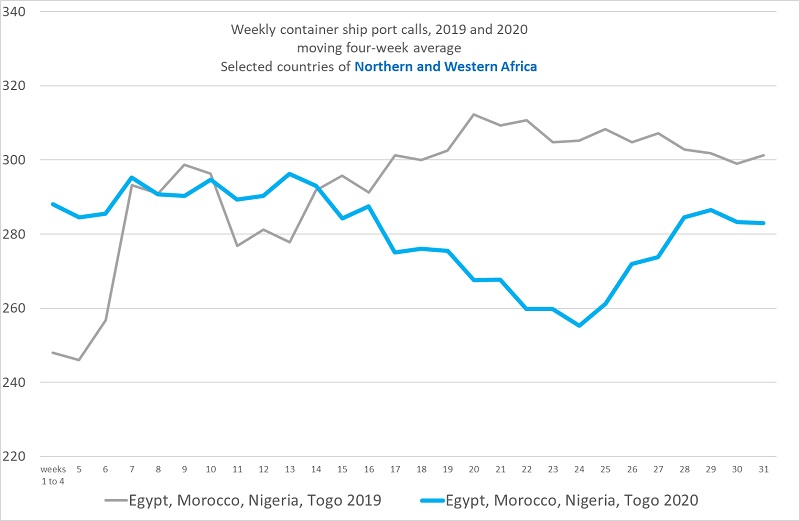
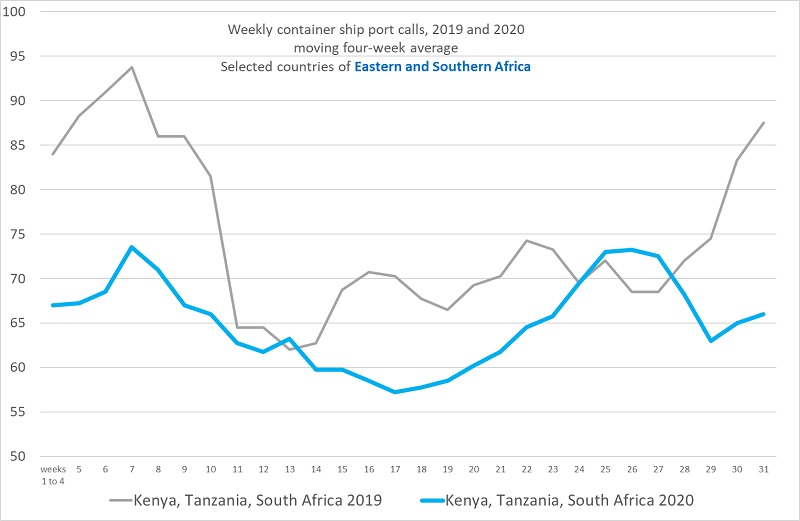
As shown in Figures 1 and 2, container ship port calls varied across regions in the first 31 weeks of 2020. At the global level, container ship arrivals started to fall below the 2019 levels around the 12th week (mid-March 2020) and to recover gradually around the 25th week (third week of June).
These timelines coincide with the date on which the World Health Organization characterized the COVID-19 as a pandemic and Europe became its epicentre. The gradual recovery since June corresponds with the easing out of lockdowns in some countries.
Figure 1: Weekly average containership port calls during the first 31 weeks of 2020 compared to the same period in 2019
Source: UNCTAD, based on data provided by MarineTraffic.
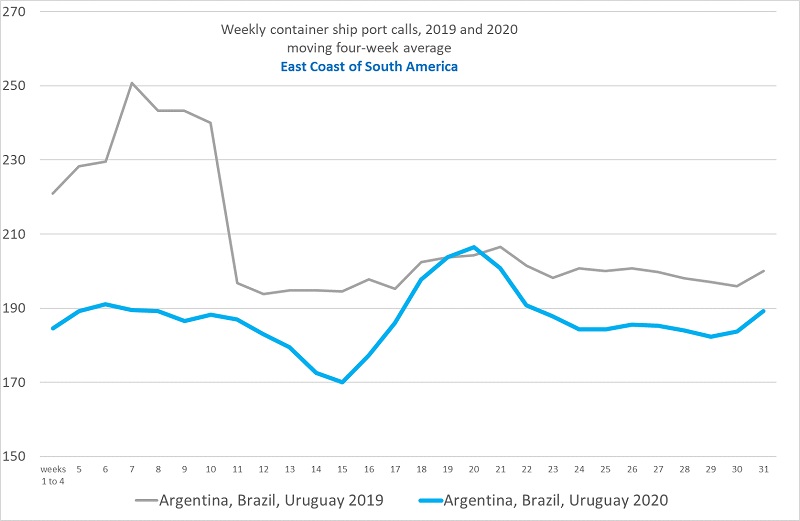
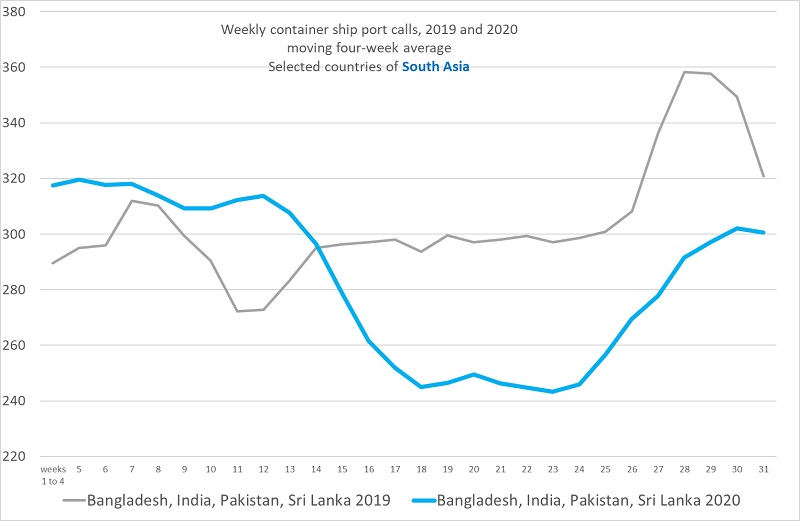
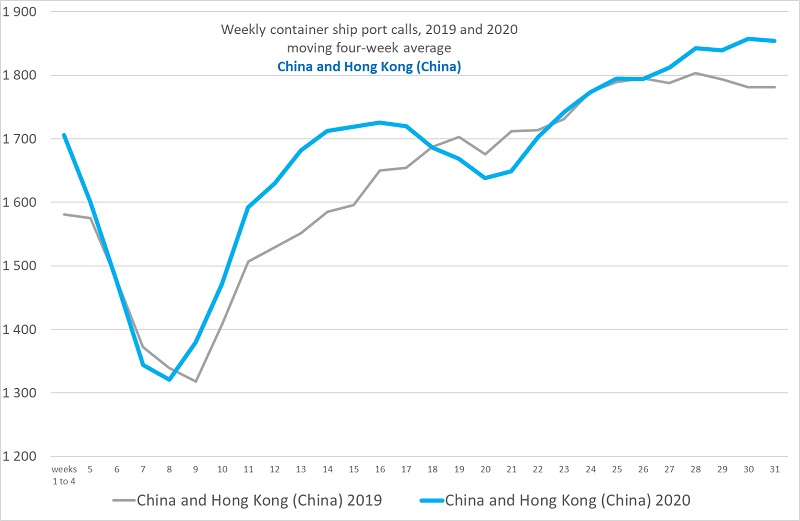
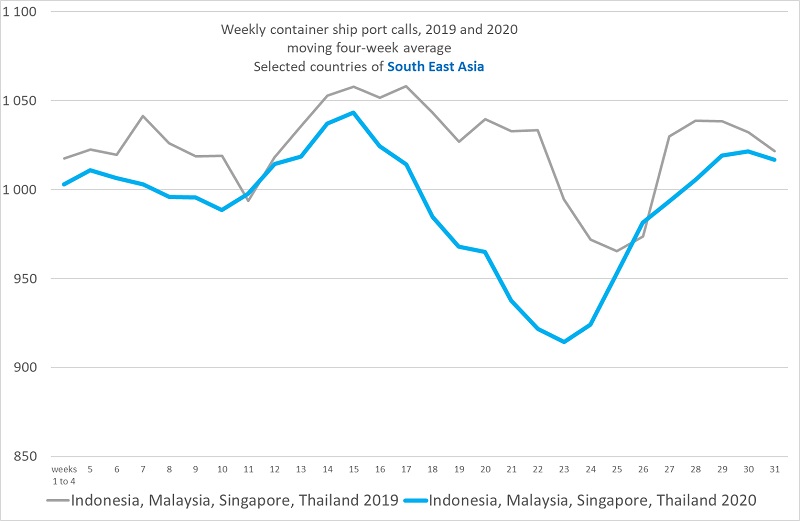
Selected examples across regions (Figure 2) are pointing to some common patterns but also differences and volatility in container port calls. While weeks 6 to 9 are marked by lockdowns in China, recovery in ship calls at Chinese ports since the 11th week of 2020, evolved along a unique pattern diverging from trends in neighbouring Asian countries as well as other countries in other regions. Distinct port call patterns in South America and Africa can also be observed, probably reflecting the delayed onset of the COVID-19 outbreak and lockdowns.
Most regions have seen some recovery starting in the third quarter of 2020, both in absolute numbers and compared to 2019 levels. However, at the global level, port calls were still 3.0 per cent below their 2019 levels in early August. North America and Europe were 16.3 and 13.2 per cent below 2019 port calls, respectively. South East Asia had almost reached its previous year’s levels (minus 0.5 per cent), while port calls in China and Hong Kong (China) already surpassed their 2019 values at plus 4.1 per cent. The regional and country trends appear to follow the progress of the pandemic, with recoveries earlier in some regions than in others.
Diverging and volatile port call patterns across regions observed since June 2020 underscore the fragility of the apparent recovery and the presence of factors that extend beyond the pandemic and the lockdowns. Not all weekly changes in port are the result of the COVID-19 disruption. Seasonal factors such as those due to the Chinese New Year are also at play. Furthermore, trade policy changes resulting in shifting trade patterns and regulatory measures that affect shipping and ports can also affect port calls. Meanwhile, carriers’ ship deployment strategies, network and port call configuration as well as decisions by shipping Alliances, can all influence port call choices.
Figure 2: Weekly container ship port calls, world and selected regions
Source: UNCTAD calculations, based on data provided by MarineTraffic. Includes all vessel arrivals of container ships of 5000 Gross Tons and above.
Note:Data reports the moving average over four weeks, up to week 31 of 2020 ending on 2 August.
Differentiated impacts across shipping market segments
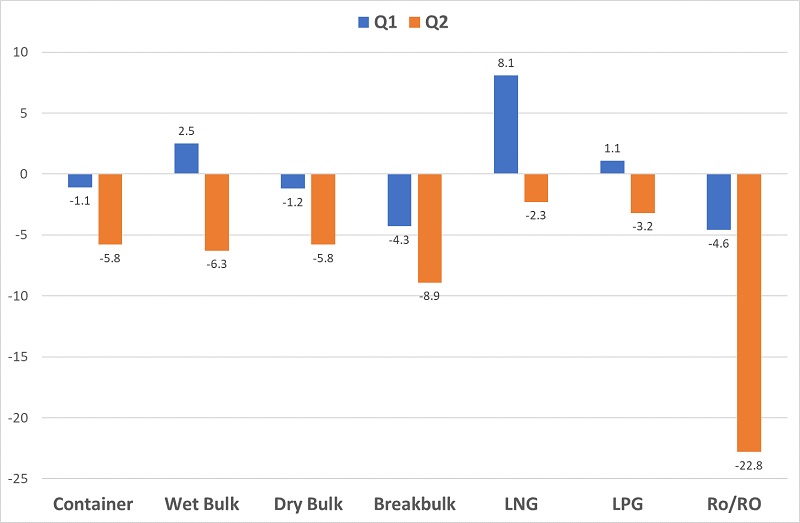
While about 60 per cent of seaborne trade by value is estimated to be carried in containers, other markets are important too, and have been affected differently by the pandemic. As illustrated in Figure 3, LNG, LPG and wet bulk carriers have recorded increases in port calls during the first quarter. In the second quarter, however, all vessel types saw a decline in port calls. The hardest hit were the RO/RO ships, which include ferries and other vessels that also carry passengers.
Figure 3: Change in port calls by market segments, Q1 and Q2 2020 vs Q1 and Q2 2019
Source: UNCTAD report “COVID-19 and maritime transport: Impact and responses”, Geneva, based on data provided by MarineTraffic.
Shipping schedules indicate strict capacity management by carriers and improved expectations for the demand outlook since the 3rd quarter
In addition to data on port calls, it is interesting to look at container shipping timetables, i.e. the planned deployment of cargo carrying capacity, measured in Twenty-foot Equivalent Units (TEU). Fleet deployment informs about shipping lines’ expectations for near future demand. The schedules reflect carriers’ offer to provide regular services based on what they expect in terms of shippers’ demand.
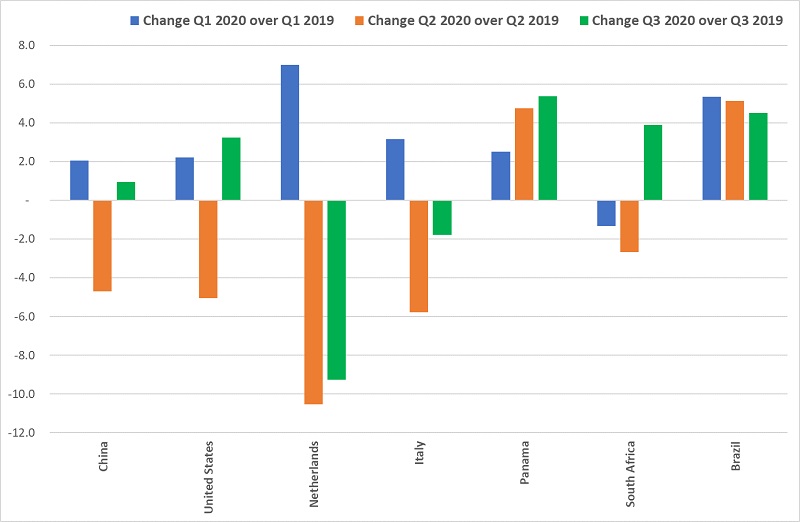
Liner shipping schedules varied across countries and quarters during the first half of 2020 (Figure 4). Among the representative economies featured, the case of Panama is worth noting. Panama recorded the largest growth in the third quarter, in line with existing reported figures about the Panama Canal. This may reflect some seasonality factors specific to the Canal traffic involving the United States East Coast-Asia trade lane. Typically, retailers in the United States build inventories with a view to the busy fall season when consumers start shopping for Christmas. It could also reflect the relief measures provided by the Panama Canal Authority, including the suspension of advance payments for transit reservation fees and other changes to the waterway’s reservation system.
Scheduled container ship capacity increased in the first quarter of 2020 as compared to the same period in 2019, for both China and the United States. Scheduled capacity declined in the second quarter for both countries, before recovering in the third quarter. The scheduled capacity in the United States recorded a relatively rapid growth in the third quarter. This may reflect a rebound after the severe cuts in scheduled capacity of the second quarter. It could also reflect some seasonality factors with retailors in the United States building inventories in preparation for the busy fall season and the Holidays. Elsewhere in Europe, liner shipping schedules increased during the first quarter but declined significantly in the second and third quarters. The demand outlook as perceived by container shipping carriers seems to have improved in South Africa during the third quarter after a fall in services during the first and second quarters. As for South America and as illustrated by Brazil, the scheduled liner shipping capacity continued its positive trend, albeit with some deceleration in the second and third quarters.
Figure 4: Changes in container ship fleet deployment, first three quarters of 2020 compared to first three quarters in 2019
Source: UNCTAD calculations, based on data provided by MDS Transmodal.
Data on shipping schedules should be interpreted with care. First, carriers may still decide to skip port calls through “blank sailings”, in case demand does not turn out as expected. Second, there is a certain risk that carriers’ expectations may be based on economic forecasts, which in turn may depend (partly) on economic analysts making use of data on shipping schedules, generating a circular dependency. Therefore, further monitoring and assessment of these trends and overlaying these with other economic indicators that reflect demand-side factors such as industrial production, manufacturing activity and export orders will be required.
Hard data on ship and cargo movements can be more telling than price indicators
Insights generated by data on physical ship movements and port activity can be more insightful than conclusions derived from more volatile nominal indicators such as prices and freight rates. This is not to say that prices should never be used when nowcasting or forecasting economic trends. Nowcasters have and continue to rely on prices and other similar indicators as they inform about demand, supply and the market dynamics. Examples include the prices of key commodities. However, these should be selected carefully while, at the same time, considering other indicators that measure trends in shipping activity.
Specifically, for dry bulk cargo shipping, such as iron ore or coal, the Baltic Dry Index (BDI) was used as a leading indicator. However, as we already pointed out in the UNCTAD Transport Newsletter earlier, the BDI not only reflects changes in demand for raw materials but also changes in the supply of shipping capacity. This reduces its usefulness as a leading indicator informing about trends in the industrial sector. More recent UNCTAD’s work on nowcasts has also found the statistical relevance of the BDI to have diminished.
For container shipping, the Shanghai Containerized Freight Index is closely monitored; it went up by 44 per cent between mid-April and the end of August 2020, not because of a surge in demand, but due to strict ship capacity management by carriers. Meanwhile, charter rates for oil tankers went through the roof earlier in the year, given the oversupply of crude oil, and, at times, the negative prices of the commodity. Traders desperately needed tankers for storage, with four times more tankers being used for storage in early 2020, compared to mid-2019.
A cautiously optimistic outlook
Despite the numerous challenges, the maritime transport industry has overall been able to weather the storm caused by the COVID-19 crisis. The industry managed to continue operations and ensure the delivery of essential goods as well as trade while at the same time maintaining profitability. Strict capacity management ensured that freight rates remained stable or even increased during the crisis, leading many carriers to expect 2020 to be a profitable year. The implications for shippers and trade of continued cuts in ship capacity should however be monitored to ensure that the current market concentration in liner shipping and the Alliances’ strategies are supportive of a sustainable trade recovery.
As highlighted by data on port calls and shipping schedules, there seems to be a pickup in shipping activity since the third quarter of 2020. Preliminary results from UNCTAD's nowcast that tracks global merchandise trade shows a similar development, estimating steep declines during the second quarter and forecasting a partial recovery in the third quarter.
On an annual basis, global seaborne trade, including containerized trade, is expected to fall in the full year 2020, in line with projected declines in world economic output and merchandise trade. Meanwhile, insights from leading indicators such as ship movements, port calls and liner shipping capacity schedules suggest that more optimistic nowcasts and forecasts can be expected in the fourth quarter of 2020. Whether the positive trends continue depends, however, on many factors, including the pathway of the COVID-19 pandemic, the effectiveness of the pandemic’s containment efforts and recovery supporting measures.
While the shipping industry managed to keep global supply chains functional, and ports remained open while protecting their workers, seafarers have been paying a high price. Many have been stuck on their ships, while others could not return to work as crew changes have not been possible during the pandemic. With improved expectations for the demand outlook, the joint UNCTAD-IMO call for governments to work together and facilitate crew changeover remains crucial.
Supporting informed policies and decisions amid pandemic times and uncertainty
UNCTAD supports informed and evidence-based maritime transport policymaking and decisions through the following three channels:
On-line statistics
Policy makers and analysts can monitor key developments in maritime transport, including port calls, the time ships spend in ports, liner shipping connectivity and container port traffic via the UNCTAD maritime statistics portal. Maritime country profiles are available to all countries and provide key information about countries’ participation in maritime business.
Nowcasts and economic barometer using shipping data and intelligence as inputs
UNCTAD’s nowcasts on trade and economic growth include a number of maritime indicators, which provide timely inputs into the latest trends. The nowcasts use a combination of extrapolation of past times series to the future and the estimation of aggregate underlying factors to produce estimates for indicators not yet published. Including more timely indicators in the nowcasts allows a more robust estimation of the factors at later points in time, increasing the quality of predicted economic indicators well before their actual values are published. UNCTAD plans to elaborate an economic barometer that draws extensively on existing maritime trade indicators to leverage their timeliness and frequency, particularly the AIS data. Such a barometer could serve as an “early warning system” or leading indicator informing about the trajectory of business cycles.
Build capacity to improve risk management and “build better” in a Post COVID-19 world
In addition to ongoing work on transport and trade facilitation, UNCTAD has been focusing attention on assisting countries in their efforts to cope with the pandemic and its fallout. UNCTAD supports their efforts to better prepare for future disruptions through enhanced resilience and risk management. For example, under a new technical assistance project on transport and trade connectivity in times of COVID-19, UNCTAD, in collaboration with the five United Nations regional commissions, is helping governments and industry to keep transport networks and borders operational as well as facilitate the flow of goods and services, while, at the same time, containing the spread of the COVID-19 disease. In the area of maritime transport, the project harnesses the various maritime transport datasets discussed above to help assess the impacts of the pandemic on the maritime supply chain and to formulate adequate response measures. [1] A set of lessons learned and good practices is being compiled and will be widely disseminated together with guidance on resilience building and future proofing of the maritime supply chain.
[1] See also the project report “COVID-19 and maritime transport: Impact and responses”
Contact the authors:
- Jan Hoffmann / Chief, Trade Logistics Branch (TLB) / [email protected]
- Hassiba Benamara / Economic Affairs Officer, TLB / [email protected]
- Daniel Hopp / Associate Statistician, Statistics and Information Branch / [email protected]
- Luisa Rodriguez / Economic Affairs Officer, TLB / [email protected]
Disclaimer
This site may contain advice, opinions and statements of various information providers. The United Nations does not represent or endorse the accuracy or reliability of any advice, opinion, statement or other information provided by any information provider, any User of this Site or any other person or entity. Reliance upon any such advice, opinion, statement, or other information shall also be at the User's own risk. Neither the United Nations nor its affiliates, nor any of their respective agents, employees, information providers or content providers, shall be liable to any User or anyone else for any inaccuracy, error, omission, interruption, deletion, defect, alteration of or use of any content herein, or for its timeliness or completeness, nor shall they be liable for any failure of performance, computer virus or communication line failure, regardless of cause, or for any damages resulting therefrom.
Explore other articles from our Transport and Trade Facilitation Newsletter

