
Written by Jan Hoffmann, Luisa Rodriguez, Benny Salo, and Antonella Teodoro, Article No. 114, [UNCTAD Transport and Trade Facilitation Newsletter N°101 - First Quarter 2024]
The second review of the UNCTAD Liner Shipping Connectivity Index (LSCI) and port LSCI
Changes in the container shipping industry during the past two decades have prompted UNCTAD and MDSTransmodal to undertake a second revision of methodology to calculate the LSCI and PLSCI datasets. This revision will be applied on 15 March 2024 to the data release for the first quarter of 2024 (Q1/2024) and both data series since 2006.
Over 80 per cent of international trade by volume, and about 70 per cent by value, is seaborne. Roughly two-thirds of this seaborne trade by value is containerized and transported by regular liner shipping services. Being better connected through these international transport services helps a country to trade at lower costs, faster, and with more choices.
UNCTAD connectivity data sets have shown to be valuable indicators for countries and ports to monitor their position in the global liner shipping network. Based on hard data, without having to rely on surveys or subjective opinions, they provide an indication of changes over time and rankings among countries and ports. A growing body of literature has shown that they can help gain insights into trade costs and the geography of trade[i].
This article discusses trends in the industry as reflected by different connectivity components, explaining why and how the country LSCI and port LSCI (the “PLSCI”) are being recalibrated. We conclude with a discussion of perspectives of countries’ and ports’ liner shipping connectivity as depicted by the revised index.
The 2024 revision does not change the LSCI components
The LSCI methodology 2024 revision maintains the same 6 components used to calculate the LSCI and Port LSCI before.
UNCTAD first generated the LSCI in 2004 to measure how well a country is connected to the global containerized shipping network. The original methodology to calculate the LSCI included 5 components. The schedules, i.e. timetables, of containerized shipping services, made available by the shipping lines form the basis of the LSCI.
In 2016, the LSCI was revised with improved coverage and additional data from MDST, incorporating 6 components, as enumerated below. Each one of these six components can contribute to improved access to the global liner shipping network, helping shippers to better connect with overseas markets.
- Number of direct connections: The more countries can be reached through direct shipping services, i.e. without requiring a transshipment, the faster and less risky is the connection.
- Number of weekly calls: The more often ships depart from a port, the lower the waiting time for the shipper.
- Number of companies providing services: The more choices shippers have, the less likely they are confronted with potential negative impacts of oligopolistic or monopolistic markets (i.e. higher prices and lower service quality).
- A higher number of services is an indicator of shipping options for the importer and exporter. Services may be provided jointly by various carriers, and each carrier may provide several services.
- Total deployed carrying capacity: The TEU[i] that can be imported and exported to/ from a country is an indication of the total transport service supply.
- Size of the largest ship: Larger container ships are more likely to be deployed in hub ports, providing additional connectivity to importers and exporters from the port thanks to trade between third countries. Also, ports that can accommodate larger ships tend to have better port infrastructure and port services.
The country LSCI dataset covers 187 economies and the port LSCI more than 1300 seaports. [ii] Both indexes are published quarterly, in mid-March, June, September and November.[iii]
Rescaling the LSCI and port LSCI to reflect changes in the industry and port realities
The LSCI methodology 2024 revision seeks to:
- Ensure that each of the 6 components has a similar weight in the calculation of the index to reflect better the relation between maritime connectivity and trade or transport costs
- How? Replacing the base value (using the average of each component, instead of the maximum value)
- Reflect better what an average port looks like in 2023
How? Adjusting the base year of the index (using Q1/2023, instead of Q1/2006)
During the past two decades, the containerized shipping industry has undergone several changes such as:
- Changes to the hub and spoke configuration, reflecting the growing importance of a small number of major hub ports in the network;
- A reduced number of companies accounting for a considerable proportion of the global container market, enhancing capacity-sharing collaboration through alliances and raising concerns about consolidation;
- Increased deployment of bigger ships, in search of economies of scale;
- Reinforced connections within Asia, reflecting the importance of intra-Asian trade links within globalized supply chains and the role of China in particular
- Increased importance of resilience-building considerations to cope with potential disruption.
Looking at several of these issues through the lens of trends in LSCI components, we observe a first major difference in the average of the six components of the LSCI since 2006 (Figure 1). While most components saw a long-term decline, in Q1/2023 ship size and total deployed capacity were more than double what they were in Q1/2006 (281% and 213% of 2006 values respectively).
Figure 1. Trends in LSCI components
(Country level, averages per quarter, Q1/2006 = 100)
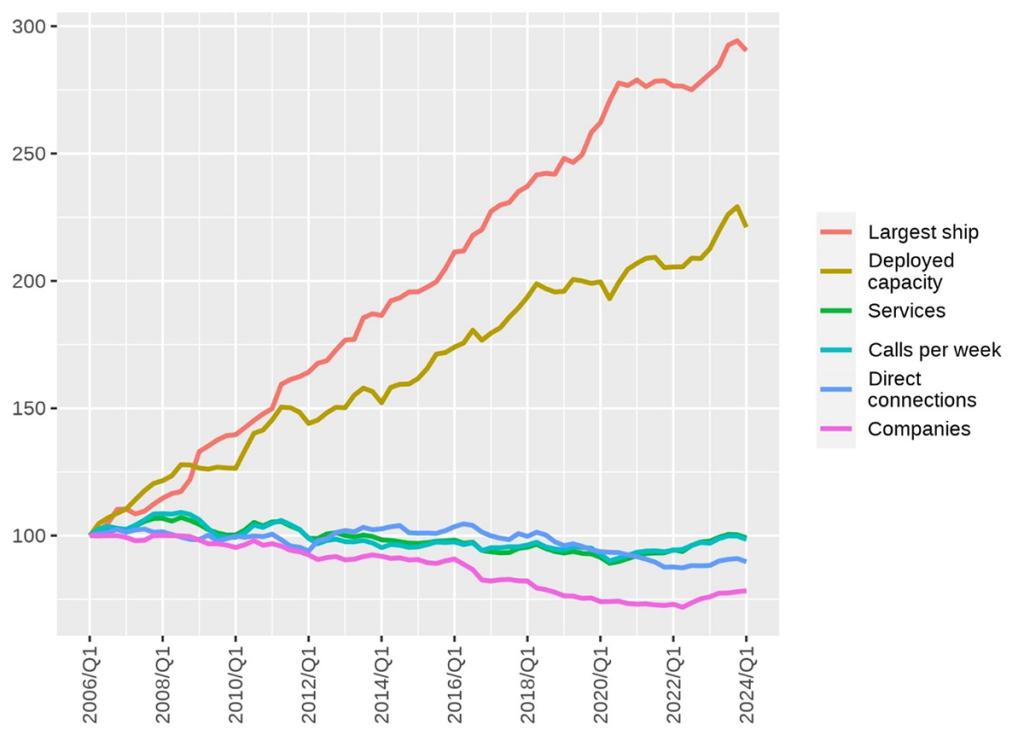
Source: Authors, based on data provided by MDS Transmodal.
A second trend relates to the increased importance of ship size in the index, as depicted in the statistical distribution of the six components in Q1/2006 and Q1/2023 (Figure 2). The distribution of the size of the largest ship has two characteristics that are different from the other components. First, it has significantly increased during the last 18 years. Secondly, it is more evenly distributed.[i] These two characteristics lead to a situation where in 2023, the contribution of this component to the average LSCI is significantly higher than that of the other five components.
Figure 2. Statistical distribution of LSCI components normalized to max in Q1/2006
(Port level, Q1/2006 and Q1/2023)
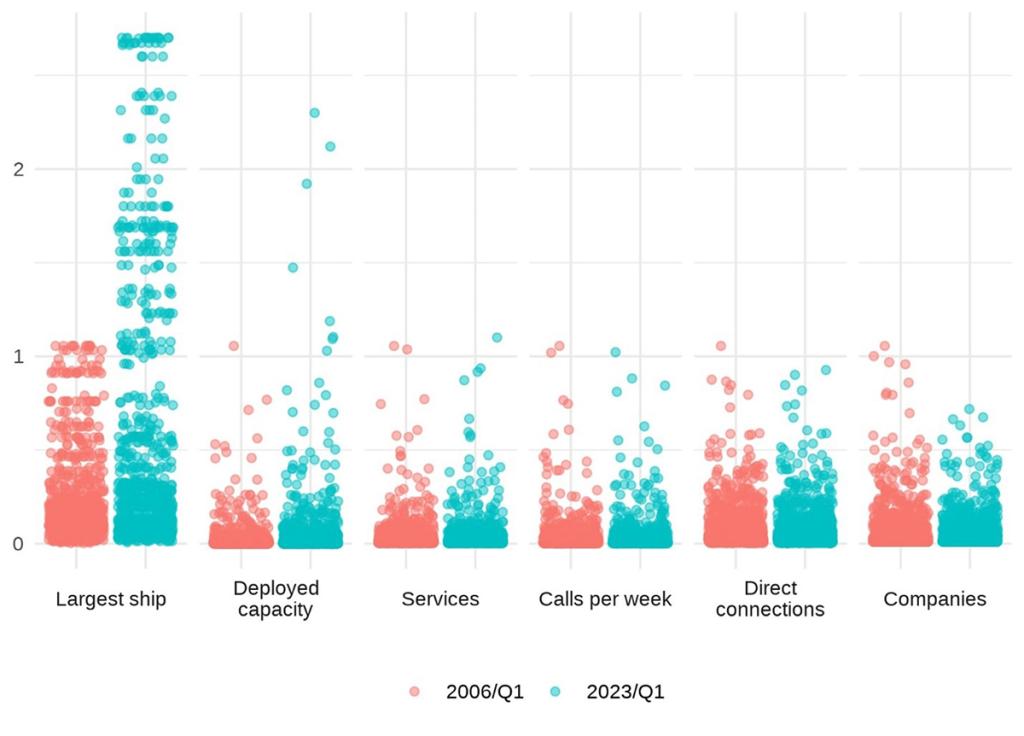
Source: Authors, based on data provided by MDS Transmodal.
Note: normalized setting maximum value of each component in Q1/2006 = 1
Among the six components, the maximum vessel size is less correlated with the other measures of connectivity. In some studies, the maximum vessel size is less relevant for trade or transport costs than the other components.[i] Thus, we consider that the LSCI needed to be recalibrated to reduce the weight of this component, increasing the weight of the others. In this context, introducing a change in the methodology that consists of dividing each component by the average (mean) value instead of the maximum value leads to a more balanced distribution across components (as illustrated in Figure 3).
Figure 3. Statistical distribution of LSCI components normalized to average Q1/2023
(Port level, Q1/2006 and Q1/2023)
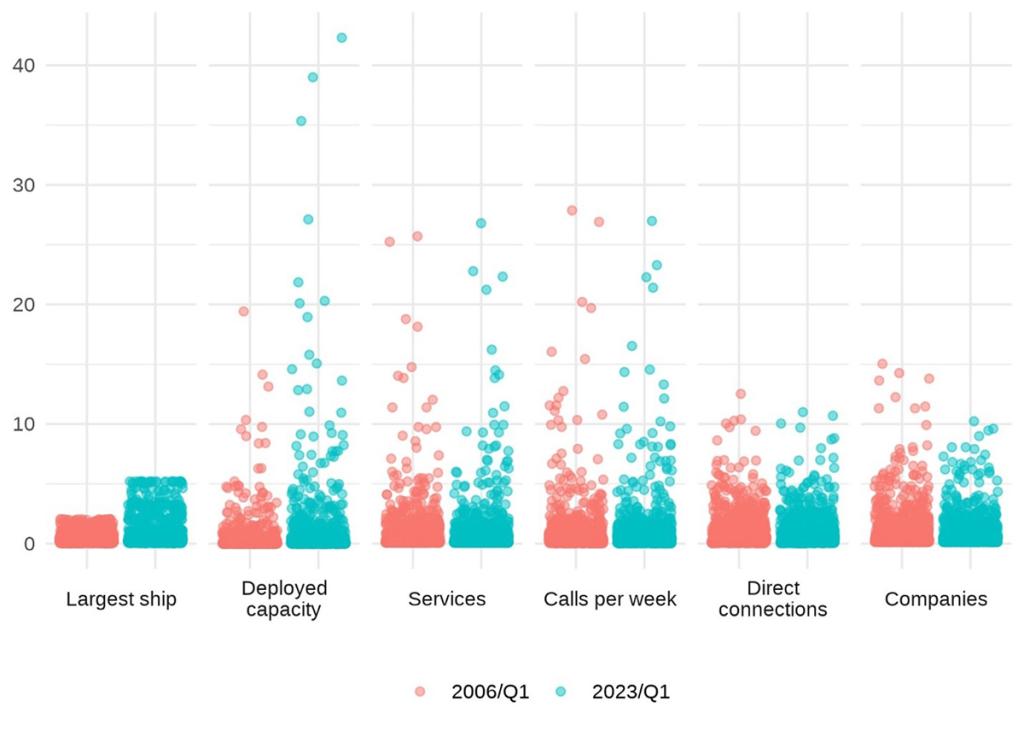
Source: Authors, based on data provided by MDS Transmodal.
Note: normalized setting average (mean) value of each component in Q1/2023 = 1
Results from the 2024 revision: the big picture remains
With the 2024 revised LSCI methodology, the big picture of leading ports, countries and regions has not changed. However:
- The average growth rate of the LSCI has declined, i.e. the overall global picture of the liner shipping network is less positive than the previous LSCI may have suggested.
- Ports whose connectivity has grown rapidly due mainly to an increase in the size of the largest ship show a relatively higher value on the 2006 index compared to the 2024 LSCI revision.
The ranking of countries and ports that receive fewer but larger ships is slightly lower in the revised index compared to the old index. By the same token, countries and ports that do not receive the largest ships but have many connections, and services and are served by many carriers see their ranking increase.
The 2024 revision envisages the following changes in the calculation of the country LSCI and port LSCI:
| From: LSCI 2016… | … To: LSCI 2024 |
|
|
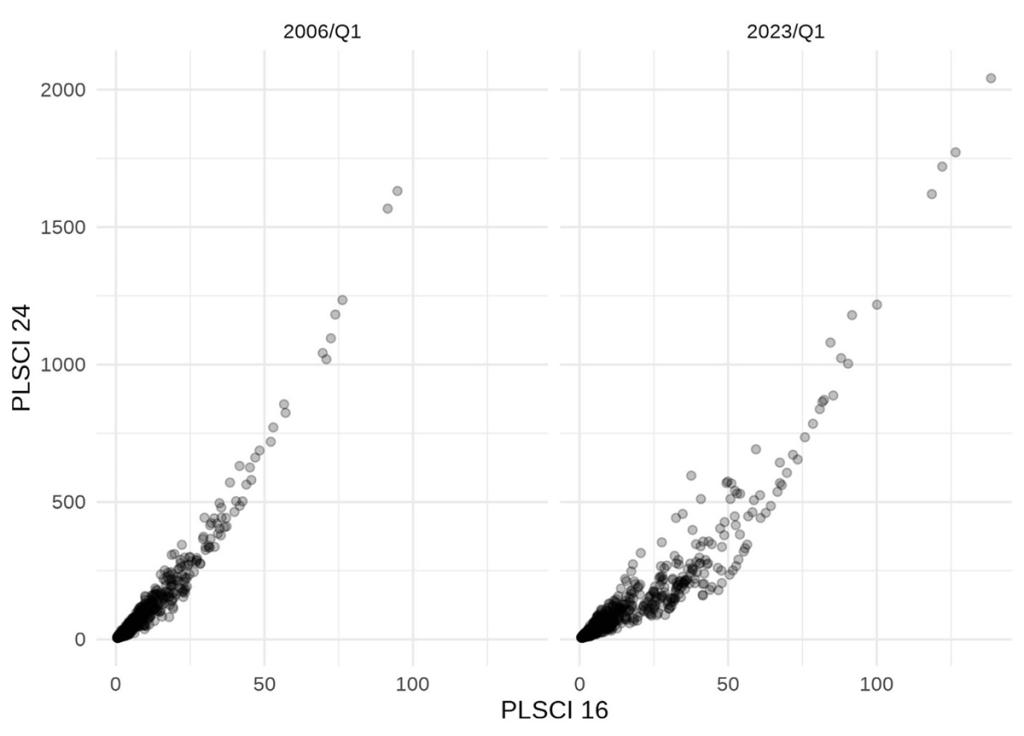
To illustrate the results, we compare the Port LSCI 2016 with the Port LSCI 2024. Both are closely correlated (as illustrated in Figure 4). The correlation is stronger in 2006 while the revision has a bigger impact for more recent values. The curvilinear relationship between the two index versions in 2023 shows that several ports have a relatively higher value on the 2006 index than on the 2024 index. These are typically ports that have grown especially rapidly regarding the size of the largest ship. As the overweighting of this component is removed in the 2024 index, the relative position of these ports is also revised downwards.
Figure 4. Comparison of new Port-LSCI (PLSCI 24) with previous Port-LSCI (PLSCI 16)
Interpreting the index values and the source of changes
The reference value 100 is chosen differently in the 2024 version and the 2016 version. Because of this, the revised LSCI and PLSCI are on a different scale compared to their prior version.
The LSCI and the PLSCI in the 2016 and 2024 versions are indices in relation to a reference set at 100. The index values 50 and 200 are meaningful only in the sense that they are, respectively, half and double the reference value.
In the 2016 version, the reference value 100 was set to the highest value in Q1/2006. For the Country LSCI this was China, for the Port LSCI, it was the port of Hong Kong. All index values in the previous versions were in relation to those reference values. For example, a PLSCI of 130 would be interpreted as 30% above the index for the port of Hong Kong in Q1/2006.
In the revised versions, the reference is the average country or port in Q1/2023. No country or port has a value of 100 in Q1. Rather, 100 is the value for a theoretical country or port that would have the average value on each of the six components. A PLSCI of 130 would here mean 30% above the index for the average port in Q1/2023.
This change in the reference value results in a different scale for the revised indices. On average, ports have a new PLSCI about eight times higher compared to the 2016 version, but this ratio ranges from 2.5 (for a port with a single big ship calling the port infrequently) to 19 for a port with many port calls by relatively small ships. The new country LSCI is, on average, 4 times higher than the previous LSCI with a range of this ratio from 1.7 to 7.6. In other words, no given multiple will transform the previous index to the revised index. This is because the components have different weights.
The change in weights derives from the change used for normalizing the components. For all components, the values used are lower in the revised indices but the magnitude of this change is different between components. The fact that normalizing values are lower makes the revised index generally higher. It is the relative difference in this change that adjusts the weight of each component to be more reflective of connectivity in 2023.
The values used for normalizing components in the different index versions are found below.
| LSCI 2016 Largest values per component in Q1/2006 | LSCI 2024 Average value per component in Q1/2023 | |
| Number of direct connections: | 111 | 24.6 |
| Number of weekly calls | 396 | 33.0 |
| Number of companies providing services | 97.3 | 14.5 |
| Number of services | 382 | 34.8 |
| Total deployed carrying capacity: | 40.9 million TEU | 5.83 million TEU |
| Size of the largest ship | 8860 | 8350 |
|
| These values produce a score of 703 on LSCI 2023 | These values produce a score of 27.2 on LSCI 2016 and 100 on LSCI 2023 |
| Note: Since the same port did not have the maximum value on all components in Q1/2006, the index value was adjusted so that the highest LSCI 2016 index in Q1/2006 was 100. A theoretical port that would have had the highest value on each component would have had an index 106. | ||
| PLSCI 2016 Largest values per component in Q1/2006 | PLSCI 2024 Average value per component in Q1/2023 | |
| Number of direct connections: | 328 | 26.2 |
| Number of weekly calls | 291 | 10.4 |
| Number of companies providing services | 97 | 6.45 |
| Number of services | 282 | 11.0 |
| Total deployed carrying capacity: | 34.8 million TEU | 1.79 million TEU |
| Size of the largest ship | 9380 | 4620 |
|
| These values produce a score of 1620 on PLSCI 2023 | These values produce a score of 13.5 on PLSCI 2016 and 100 on PLSCI 2023 |
| Note: Since the same country did not have the maximum value on all components in Q1 2006, the index value was adjusted so that the highest PLSCI index in Q1/2006 was 100. A theoretical country that would have had the highest value on each component would have had an index 106. | ||
In conclusion, by recalibrating the LSCI to consider newer data in the base value and a different weighing of components, we believe that the country and port LSCI serve better the purpose of providing an indicator for a port’s or a country’s liner shipping connectivity. With the 2024 revision, the big picture remains with slight adjustments. The revised LSCI and PLSCI are on a different scale compared to their prior version
By combining hard data from six components of liner shipping schedules, the 2024 revised methodology to calculate the LSCI and Port LSCI continues to provide a broad indication of trends and positions in the global liner shipping networks. For ports or policymakers that want to improve their ports’ or country’s connectivity, it will then be necessary to analyse the underlying raw data, or – ideally – go into more detail looking at specific routes, products, or suppliers.[i]
Endnotes
[i] Okoro, E. (2022). Global trade: testing persistence in global shipping based on the Liner Shipping Connectivity Index (LSCI); Lin P.C. et al. (2020). The direct and spillover effects of liner shipping connectivity on merchandise trade; Del Rosal, I and Grecco T (2020). The effect of shipping connectivity on seaborne containerised export flows; Hoffmann, J & Fugazza, M (2016). Bilateral Shipping Connectivity since 2006; Hoffmann, J & Fugazza, M (2017). Liner shipping connectivity as determinant of trade. Arvis et al. (2013). Trade costs and development: a new dataset; Wilmsmeier G and Hoffmann J. (2008). Liner Shipping Connectivity and Port Infrastructure as Determinants of Freight Rates in the Caribbean; Clark X. et al. (2004). Port Efficiency, Maritime Transport Costs, and Bilateral Trade.
[ii] Twenty-foot Equivalent Units, i.e. a standard small 20-foot container.
[iii] There are 1328 unique ports in the dataset. However, for any single quarter, we have at most 975 ports (Q1/2019). For Q4/2023 we have 838 ports.
[iv] Some aspects of network composition (calculations about routes and connections beyond direct ones, and notions of “in-betweenness” or “centrality” in network analysis) are considered in another UNCTAD connectivity dataset, the Liner Shipping Bilateral Connectivity Index, which is published annually for country pairs.
[v] The more even distribution manifests itself through the lower difference between the mean and median value, a lower standard deviation, and a lower skewness.
[vi] Hoffmann et al. (2019). Liner shipping bilateral connectivity and its impact on South Africa’s bilateral trade flows
[vii] For a more detailed list of policy measures that countries and ports can consider to improve maritime connectivity, see Chapter 6 of the Review of Maritime Transport 2017